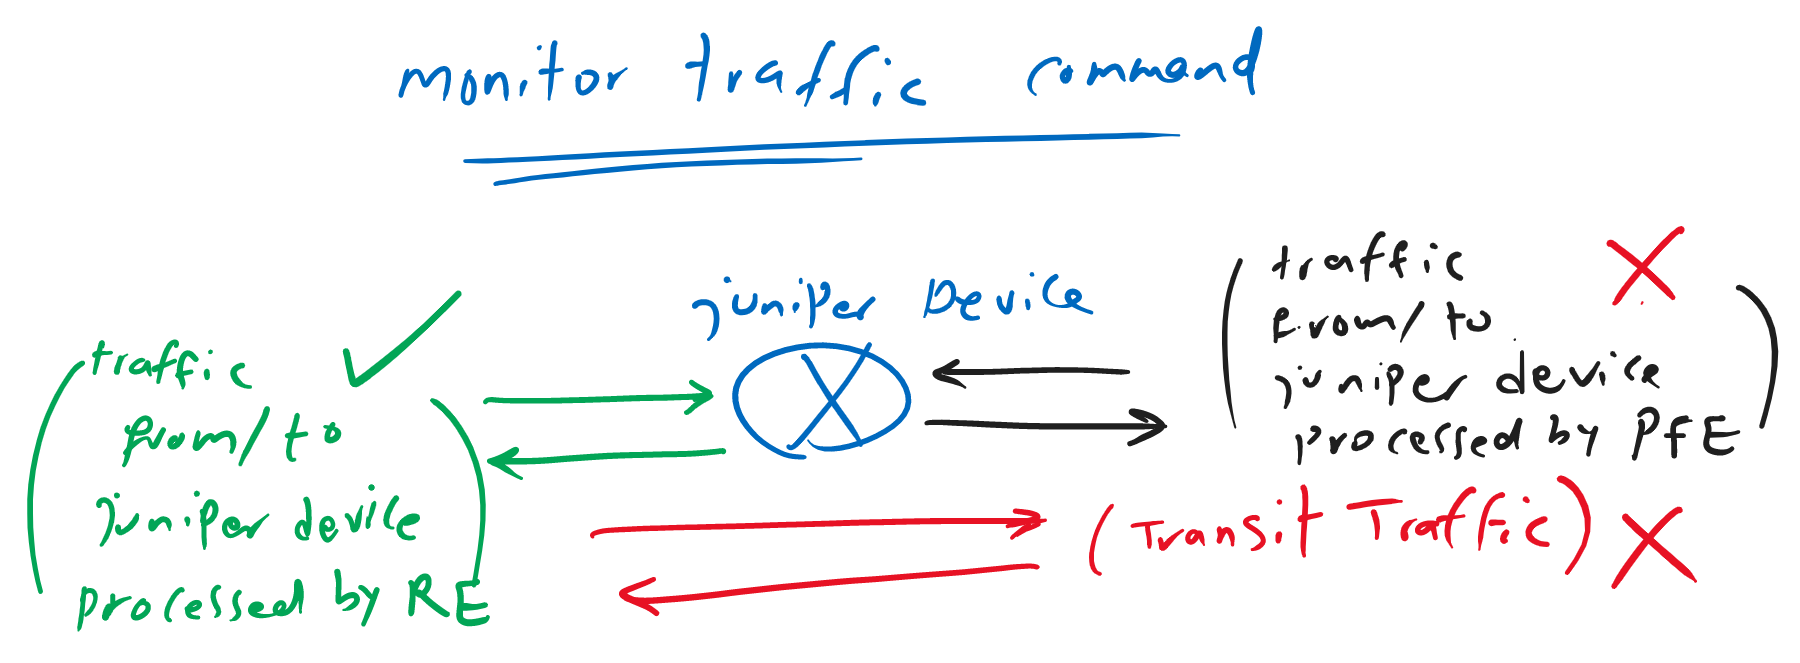

Juniper Monitor Traffic Command is another troubleshooting and analysis tool for capturing traffic, but only traffic to or from the Juniper device routing engine (RE) are captured. Transit traffic are not captured by the “monitor traffic” command.
As I explained earlier, you cannot capture transit traffic with the monitor traffic command. You can only capture the traffic from or the device itself, but it’s important to remember that it only captures traffic processed by the routing engine.
incoming and outgoing traffic processed by the Packet Forwarding Engine (PFE), even if they originate from or are destined to the juniper device itself, are not captured by the “monitor traffic” command..
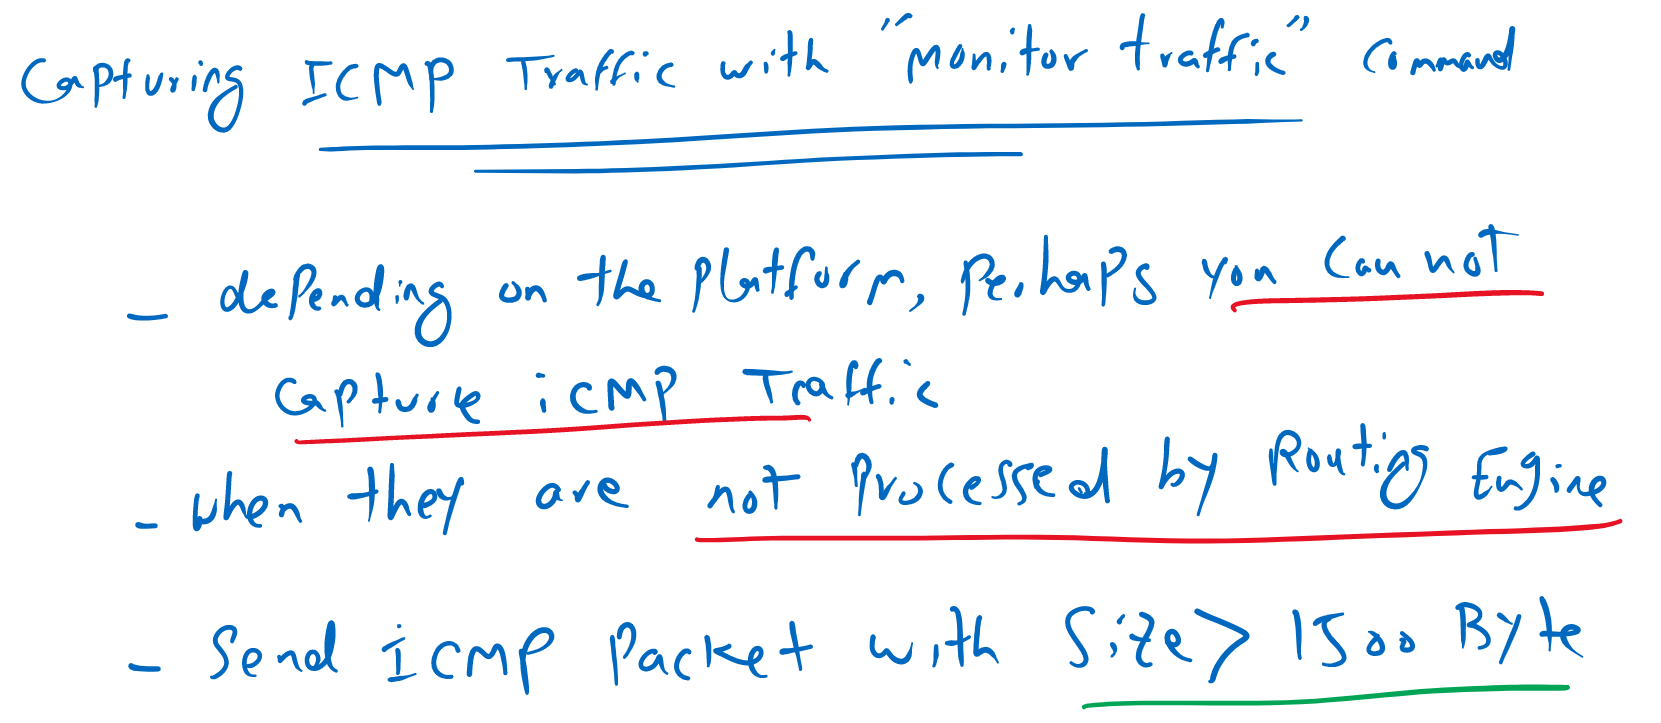
Usually when we want to test monitor traffic command, we start with sending ICMP traffic to the juniper device and we expect that we can see the result in “monitor traffic” command.
But depending of the platform, most probably, we can not see ICMP traffic in the output of “monitor traffic” command. this is because in some juniper platforms, ICMP traffic are not processed by routing engine (RE) and they are processed by packet forwarding engine (PFE).
In such situation, you can send the CMP packet with size bigger than 1500 Byte from juniper device itself, so it has to fragment the traffic before it sends the ICMP packets. This is because fragmenting ICMP traffic is handled by routing engine (RE) so you can see the ICMP traffic in “monitor traffic” command output.
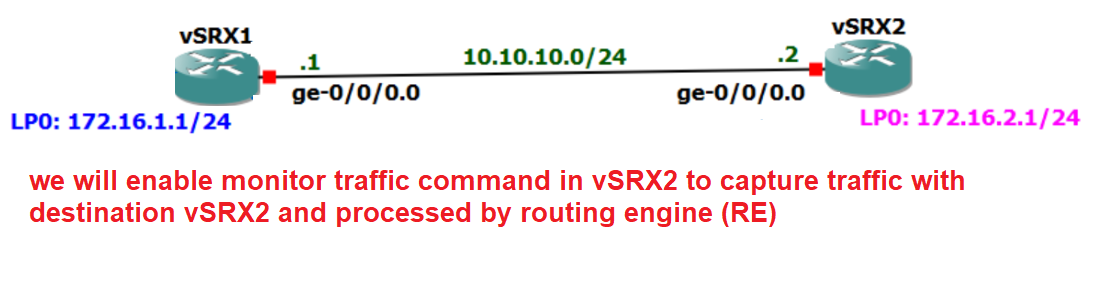
Before starting packet capture with monitor traffic command, let’s first review the topology on which we will capture traffic.
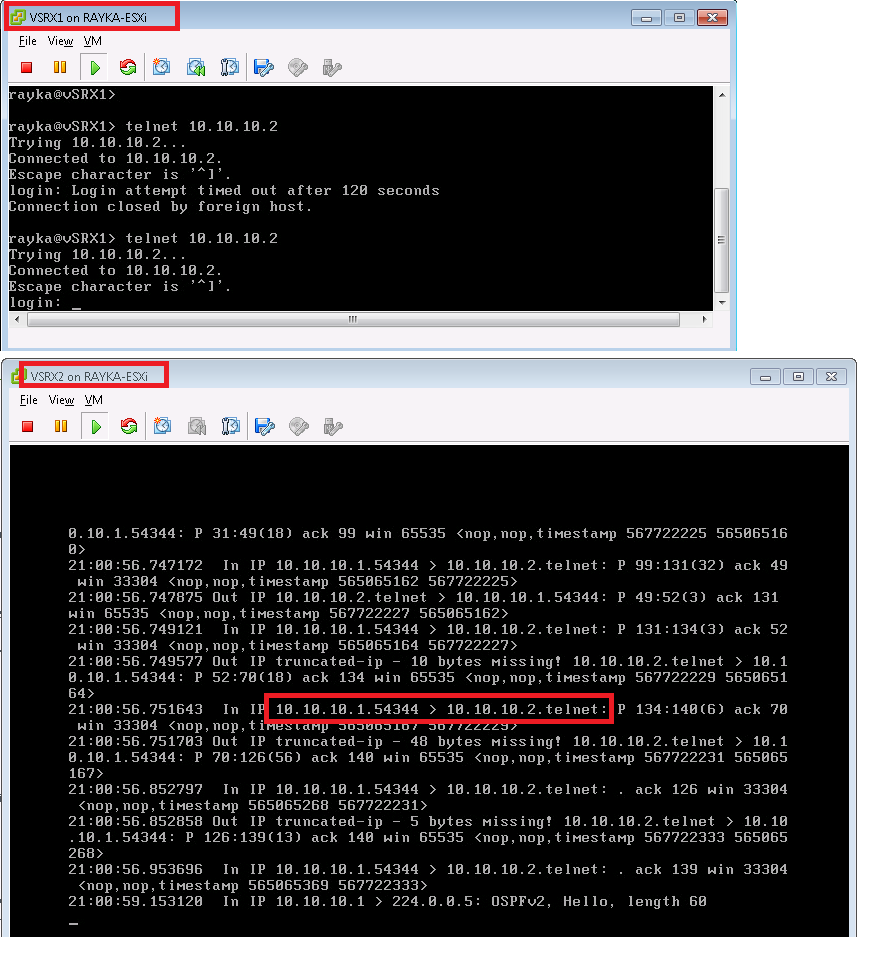
There are two vSRX devices connected to each other through ge-0/0/0 interface with IP subnet 10.10.10.0/24.
In this example we want to configure a packet capture example with “monitor traffic” command to capture some traffic destined to vSRX2.
These are some example for capturing traffic with monitor traffic command.
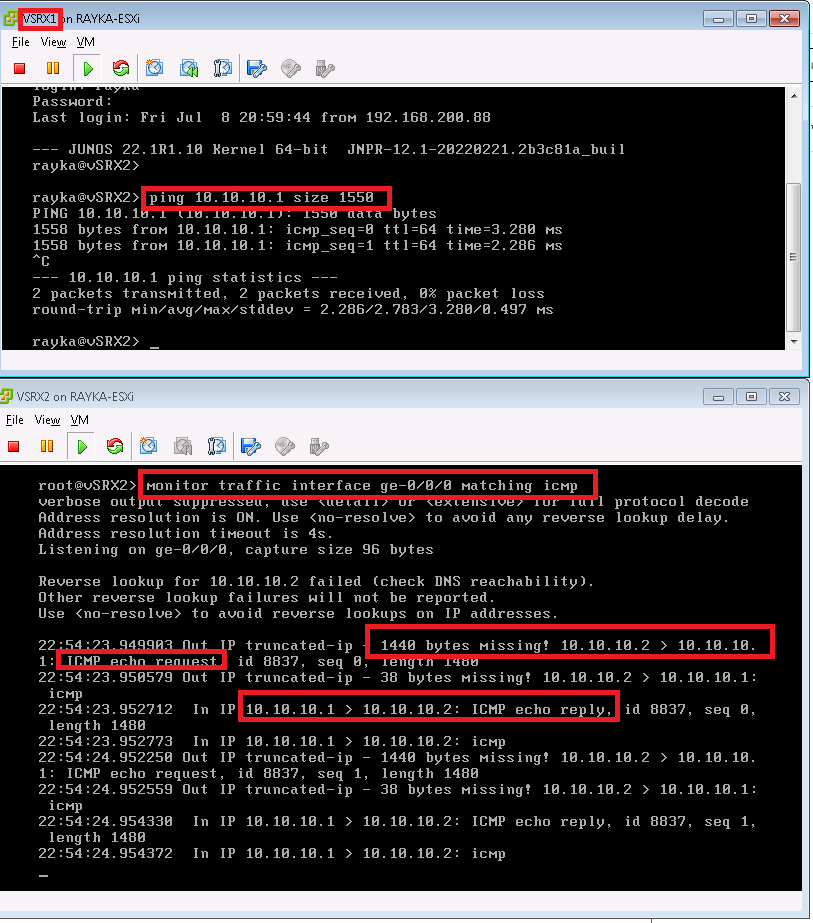
The first example, captures ICMP traffic. but as I have explained earlier, depending on the platform, probably you can not see the packets, since ICMP traffic are processed by packet forwarding engine in some platforms.
monitor traffic interface ge-0/0/0 matching icmpIf you want to see the ICMP traffic, you can send ICMP traffic with size bigger than 1500 byte from the juniper itself to force juniper device to process the ICMP traffic with routing engine.
The second command, capture traffic in interface ge-0/0/0 with the condition that source or destination IP is 10.10.10.1.
monitor traffic interface ge-0/0/0 matching "host 10.10.10.1"For capturing traffic with source or destination IP address in a specific subnet, we use the “net” option.
monitor traffic interface ge-0/0/0 matching "net 10.10.10.0/24"For capturing traffic with a specific source or destination port, we use the “port” option.
monitor traffic interface ge-0/0/0 matching "port 23" “no-resolve” option in monitor traffic command is used to eliminate the delay of querying the IP addresses from DNS server.
monitor traffic interface ge-0/0/0 matching "tcp port 23" no-resolveWith “matching arp” option we can capture arp traffic.
monitor traffic interface ge-0/0/0 matching arpThe next example show the application of logic commands “not”, “or” and “and” in matching traffic.
monitor traffic interface ge-0/0/0 matching "not tcp port 22 or tcp port 23"The next two examples show, matching and capturing traffic from a specific source or a specific destination with “src host” and “dst host”.
monitor traffic interface ge-0/0/0 matching "dst host 10.10.10.2"
!
monitor traffic interface ge-0/0/0 matching "src host 10.10.10.1"
The last example shows how to match and capture the traffic based on MAC address.
monitor traffic interface ge-0/0/0 matching "ether src 11:22:33:44:55:66"Now let’s to implement some of the mentioned command.
For the first example, we try to capture ICMP traffic with sending ICMP traffic with default size and also with the size bigger than 1500 bytes.
For the next example we generate telnet traffic from vSRX1 to vSRX2 and capture the traffic with monitor traffic “host” option to match based on IP address.