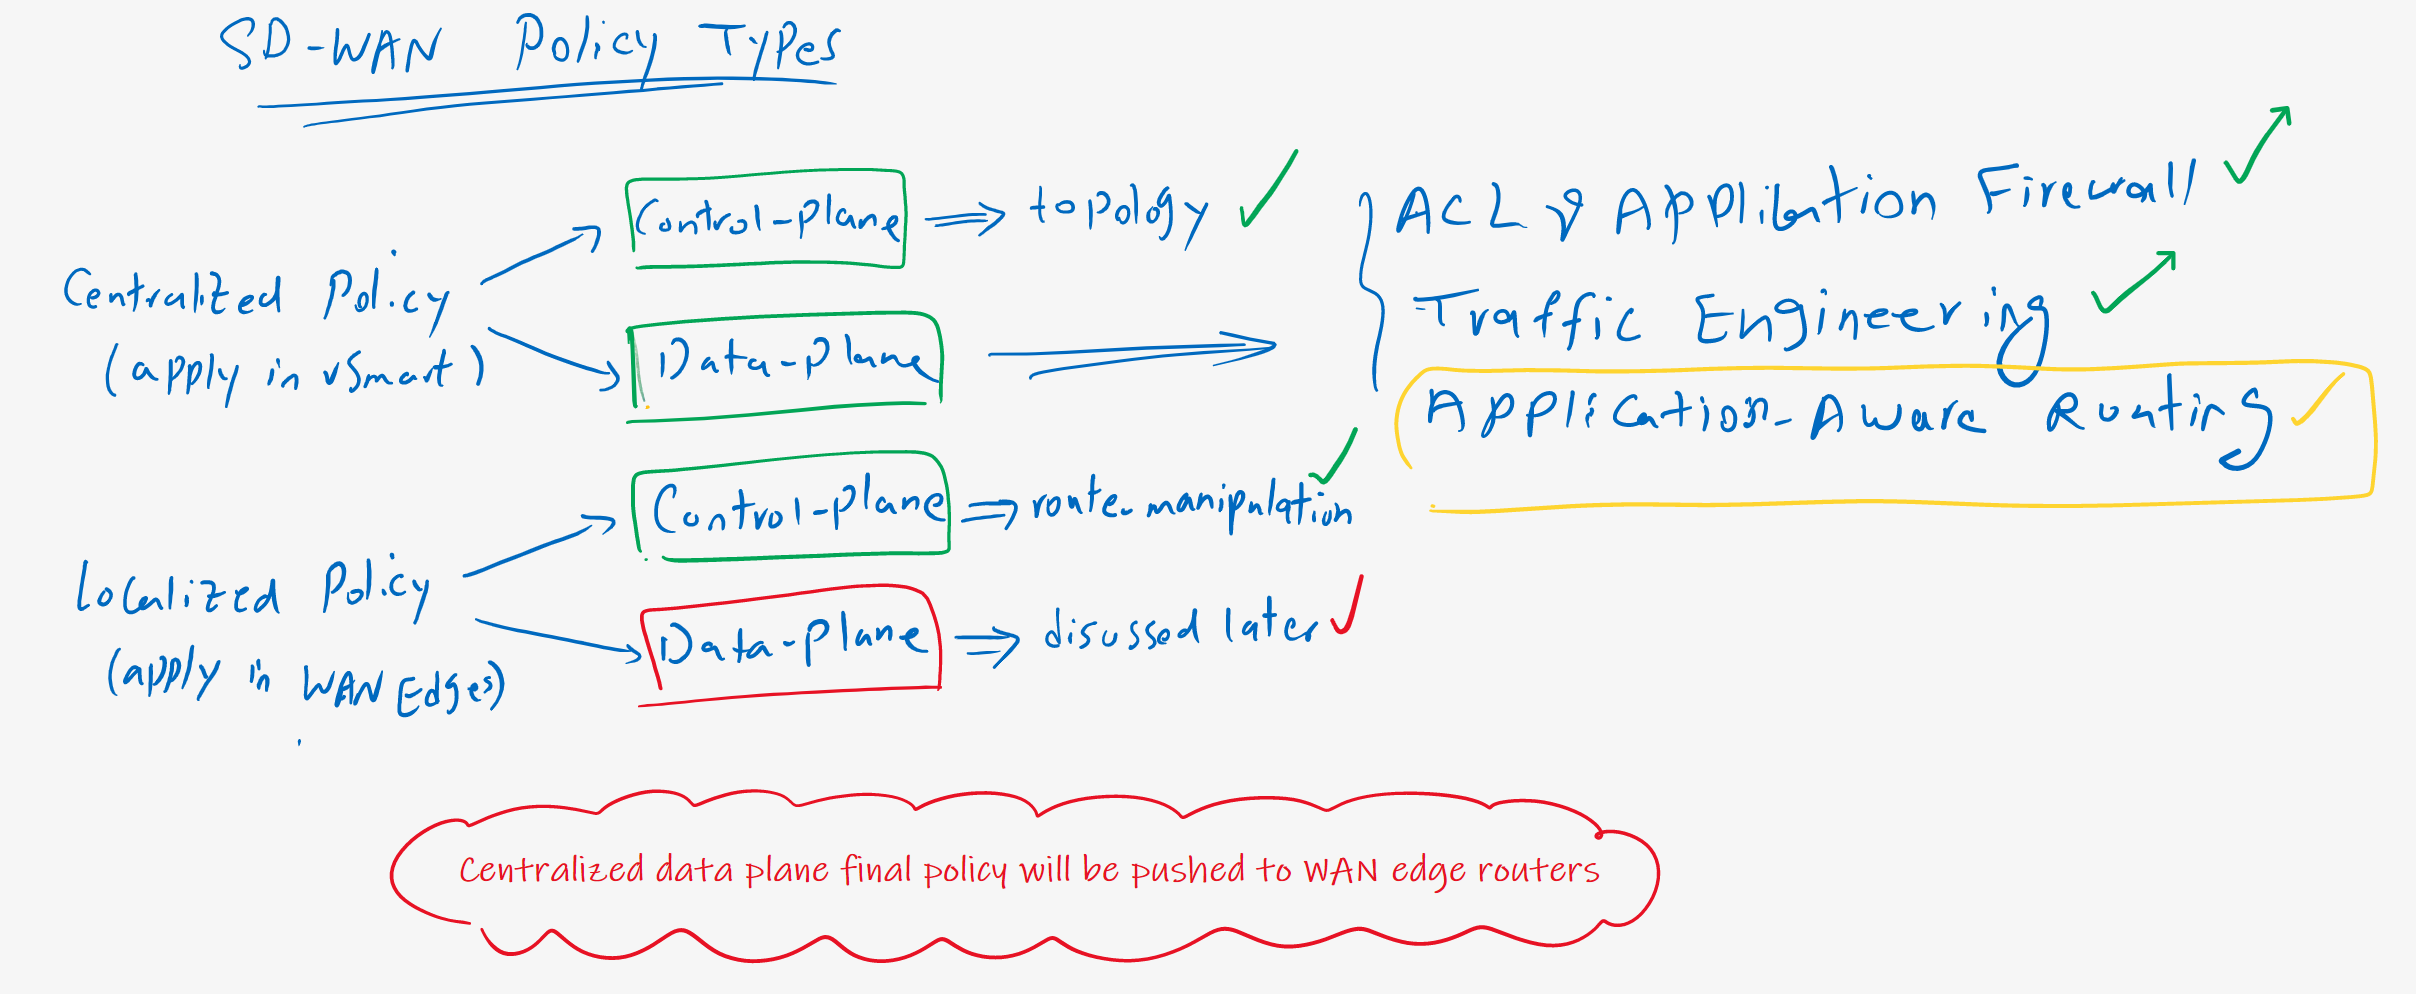
Cisco SD-WAN application routing enables routers to route traffic based on their QoS requirements. You can specify QoS requirements such as delay, jitter, and loss for each application, and application-aware routing helps the router to route traffic in a path to meet QoS requirements. This feature is a data plane policy, meaning it doesn’t change routing table.
Application Aware Routing Overview
Cisco SD-WAN Application aware routing is another centralized data plane policy.
however it is a centralized policy, but final policy must be pushed into WAN edge routers. otherwise it is not possile to implement a data plane policy in vSmart controller since data traffic never goes through vSmart controller.
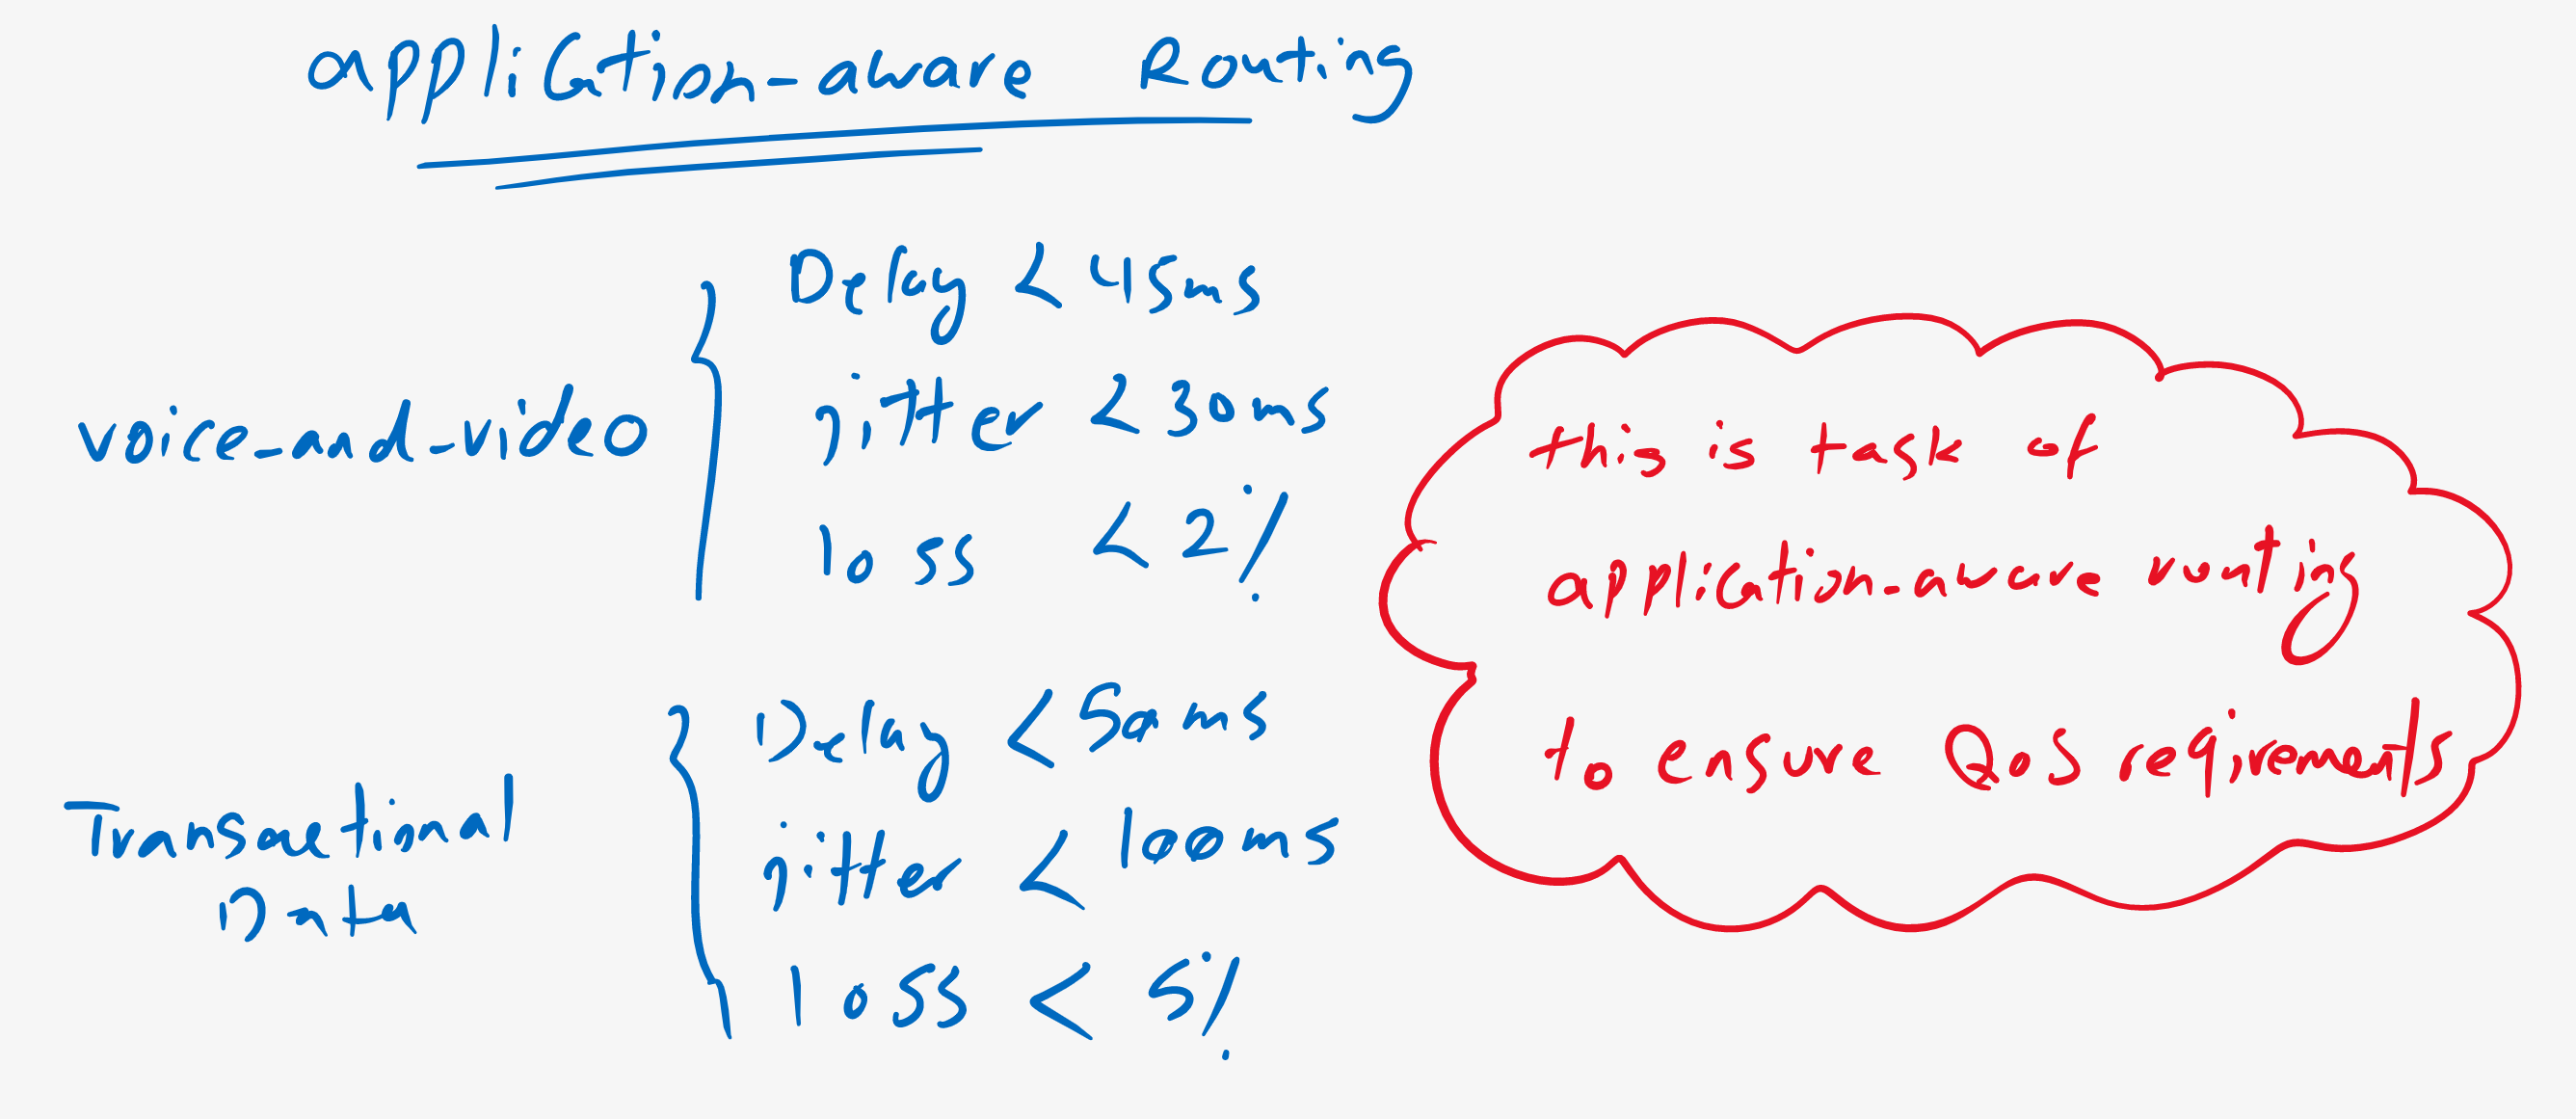
what is Cisco SD-WAN Application Aware Routing?
What is application-aware routing? With application-aware routing, traffics are forwarded on a path to ensure that their QoS requirements are met. For example, you predefine that your voice and video traffic must have a delay of less than 45 ms, a jitter of less than 30 ms, and a loss of less than 2 percent. Now this is the job of Cisco SD-WAN Application Aware Routing to route voice and video traffic on a path to ensure QoS requirement as much as possible.
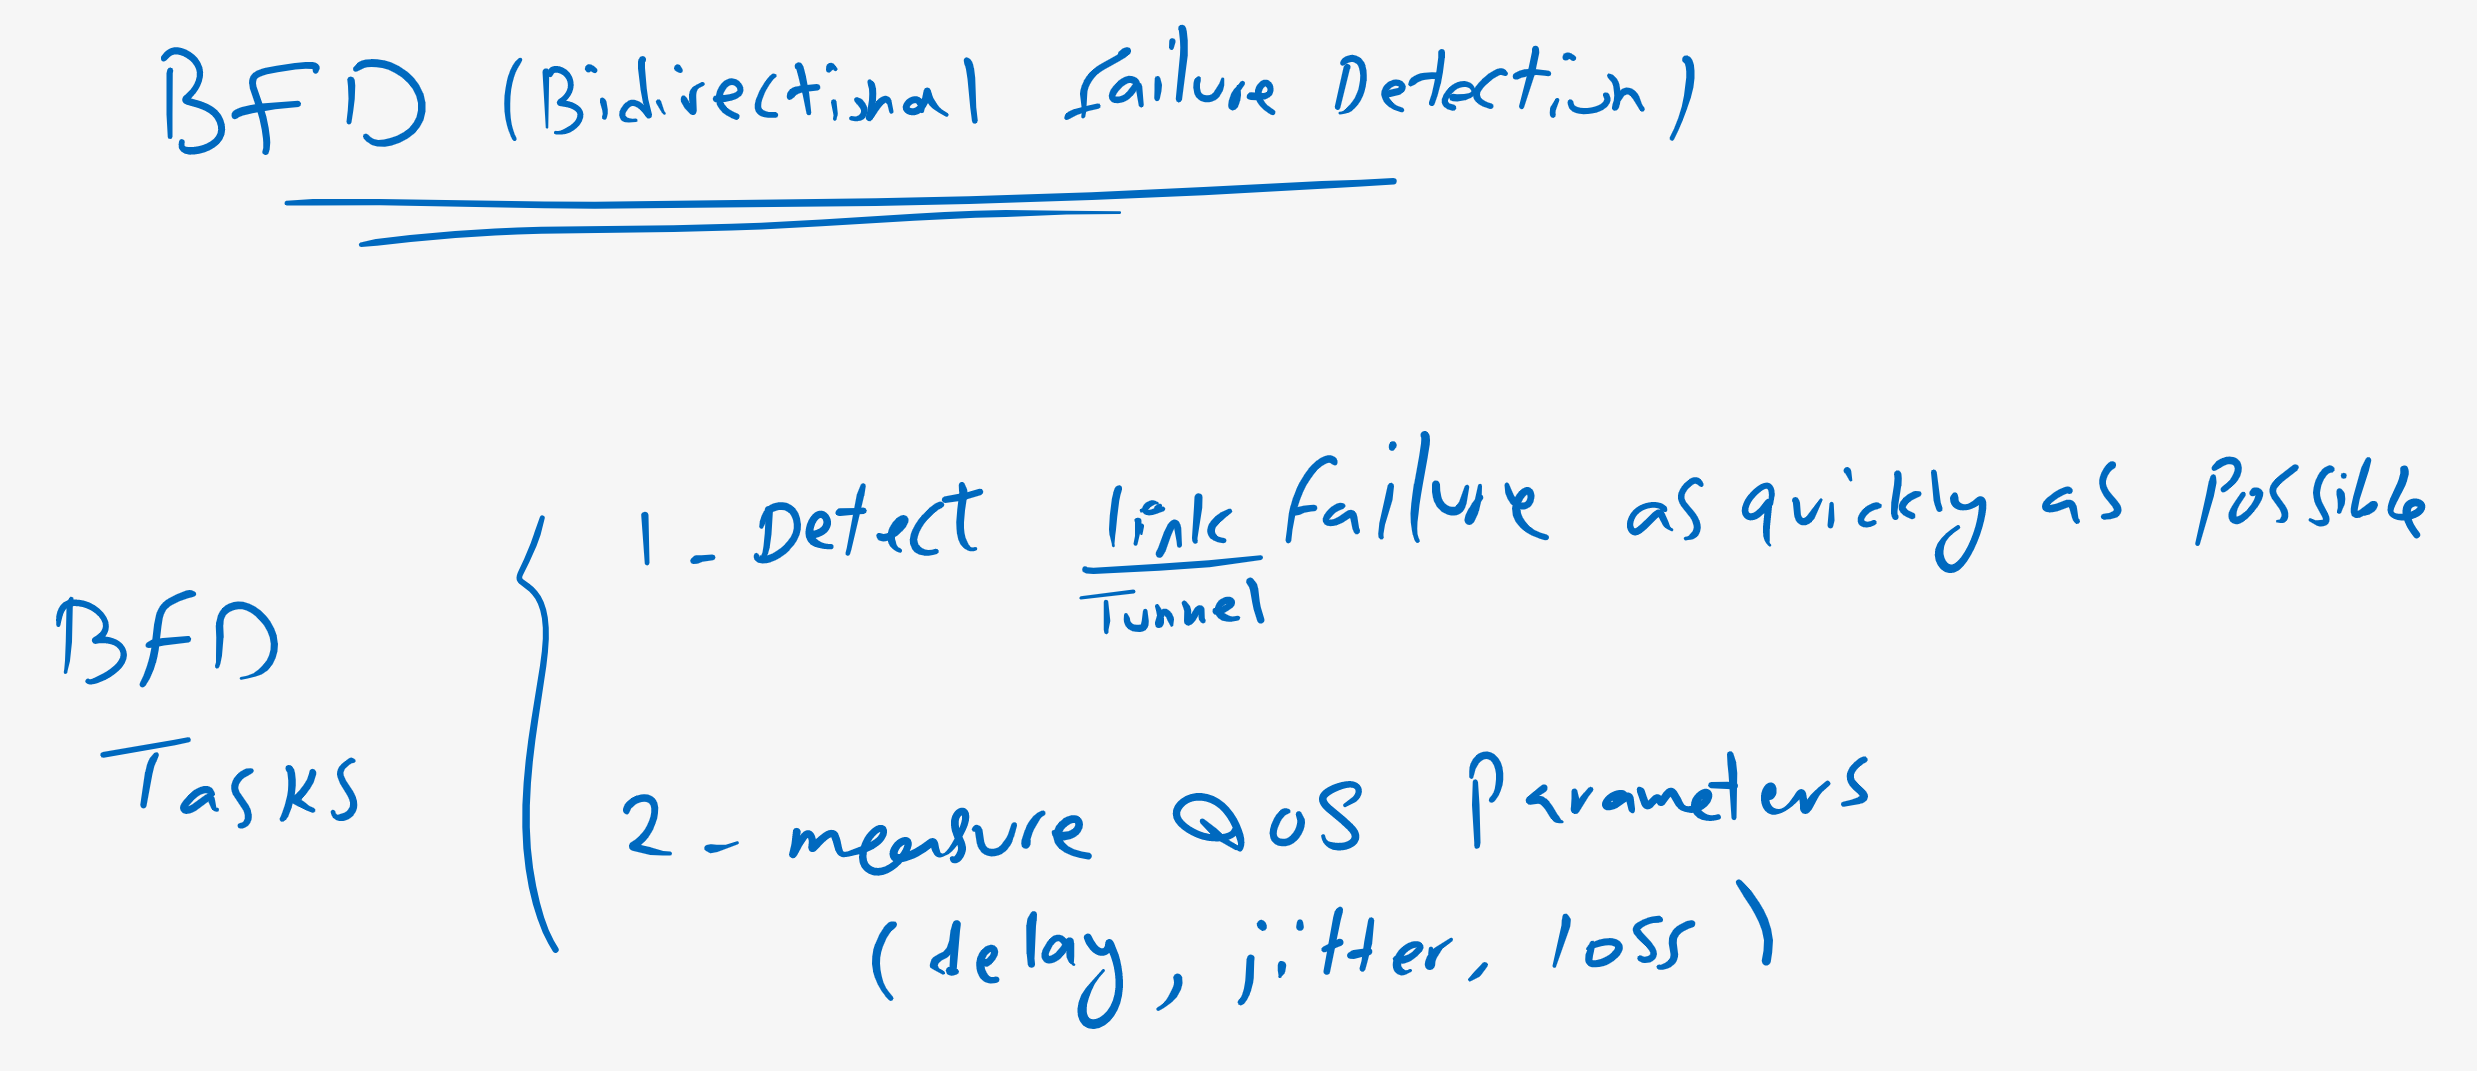
BFD Tasks
The question is, how are QoS parameters measured? BFD or “Bidirectional Failure Detection” is a protocol that not only detects link failure as quickly as possible and usually in less than 100 milliseconds, but also periodically measures QoS parameters for each end-to-end tunnel.
QoS Parameters Monitoring
We can see the result of measured QoS parameters of every tunnels in summary in the dashboard.
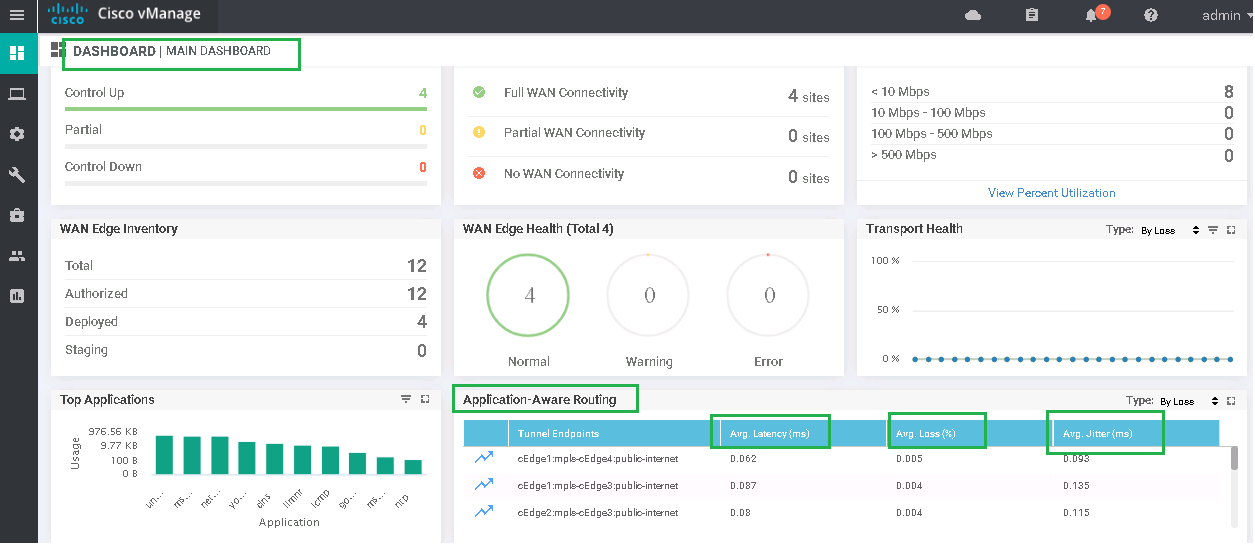
We can also check the result of measured QoS parameters of tunnels in details in Monitoring section.
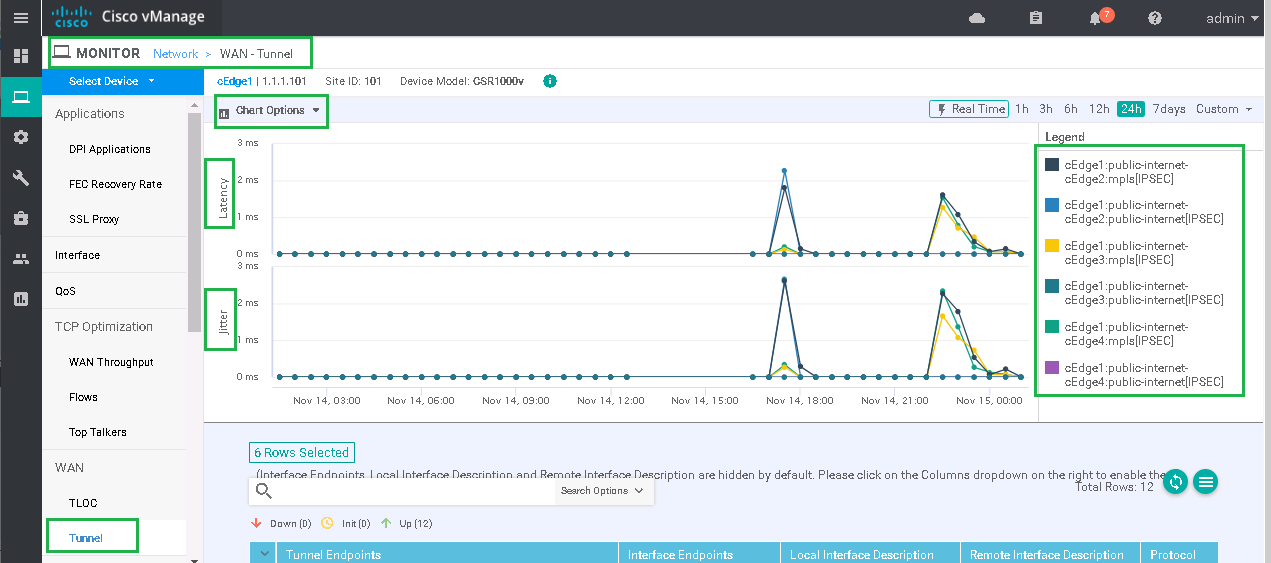
As you can see, for each tunnel, QoS parameters measurements are collected and the vSmart Controller knows exactly how is QoS status for each tunnel.
For every Tunnel, the value of delay, jitter, loss and amount of sending and receiving traffic are collected.
BFD default values and configuration
As it is already explained, BFD protocol detect failures and also measures QoS parameters. in cisco SD-WAN Architecture, default value of BFD failure detection is 7 seconds. it check tunnel’s connectivity every one second by sending hello and if there is no response within 7 seconds it will assume the connection has failed.

The default value for measuring QoS parameters is 10 minutes and application aware routing is performed every 60 minutes. In other words, every 60 minutes, it may reroute traffics according to the QoS values that it has collected.
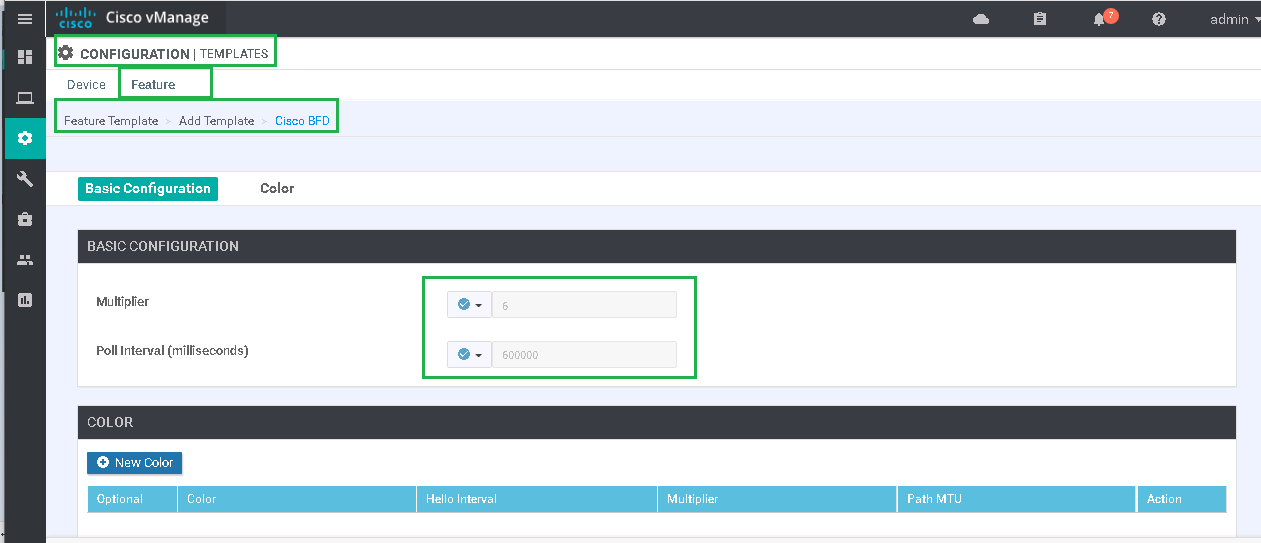
We change default values into short values so that we can see and check the result of our application routing as soon as possible. We change the poll interval to 10 seconds so that it measures and collects statistics every 10 seconds, and set the multiplier to 3 so that it does application routing every 30 seconds and possibly change path of the traffics.
CONFIGURATION -> TEMPLATES -> Feature -> Add Template
 Device Type: CSR1000v
 Template: Cisco BFD

 Template Name: CSR1000v_BFD
 Description: CSR1000v_BFD

 Multiplier: 3
 Poll Interval (milliseconds): 10000
Our new BFP policy must be applied to all Edge routers. CSR1000v_Device_Template_cEdge1 device template is applied to cEdge1 and CSR1000v_Device_Template device template is applied to all other edge routers. so we update these two device template.
CONFIGURATION -> TEMPLATES -> Device -> CSR1000v_Device_Template -> Edit
 Cisco BFD: CSR1000v_BFD

CONFIGURATION -> TEMPLATES -> Device -> CSR1000v_Device_Template_cEdge1 -> Edit
 Cisco BFD: CSR1000v_BFD
Now that we have configured our BFD polling interval to a short value, we will generate specific traffic between Site1 and Site4 to check result of QoS measurements and also result of routing. Then we will configure application-aware routing to effect traffic path.
We generate a high rate ping traffic between site1 and site4.
cEdge1#ping vrf 10 172.16.14.1 size 18024 repeat 100
Type escape sequence to abort.
Sending 100, 18024-byte ICMP Echos to 172.16.14.1, timeout is 2 seconds:
!!!!!!!!!!!!!!!!!!!!!!!!!!!!!!!!!!!!!!!!!!!!!!!!!!!!!!!!!!!!!!!!!!!!!!
!!!!!!!!!!!!!!!!!!!!!!!!!!!!!!
Success rate is 100 percent (100/100), round-trip min/avg/max = 8/166/197 ms
cEdge1#
then with command “show sdwan app-route stats remote-system-ip 1.1.1.104”, we can check not only the result of QoS measurements in the last 30 seconds but we can also check how traffics are routed between source and destination.
cEdge1#show sdwan app-route stats remote-system-ip 1.1.1.104
app-route statistics 192.168.1.101 192.168.1.104 ipsec 12346 12346
 remote-system-ip 1.1.1.104
 local-color      public-internet
 remote-color     public-internet
 mean-loss        0
 mean-latency     0
 mean-jitter      0
 sla-class-index  0
                                                          IPV6 TX  IPV6 RX
       TOTAL          AVERAGE  AVERAGE  TX DATA  RX DATA  DATA     DATA
INDEX  PACKETS  LOSS  LATENCY  JITTER   PKTS     PKTS     PKTS     PKTS
----------------------------------------------------------------------------
0      11       0     0        0        0        1        0        0
1      11       0     0        0        0        0        0        0
2      11       0     0        0        0        0        0        0

app-route statistics 192.168.1.101 192.168.2.104 ipsec 12346 12346
 remote-system-ip 1.1.1.104
 local-color      public-internet
 remote-color     mpls
 mean-loss        0
 mean-latency     63
 mean-jitter      45
 sla-class-index  0
                                                          IPV6 TX  IPV6 RX
       TOTAL          AVERAGE  AVERAGE  TX DATA  RX DATA  DATA     DATA
INDEX  PACKETS  LOSS  LATENCY  JITTER   PKTS     PKTS     PKTS     PKTS
----------------------------------------------------------------------------
0      11       0     13       16       1        1        0        0
1      11       0     118      83       0        3        0        0
2      11       0     57       37       0        0        0        0

app-route statistics 192.168.2.101 192.168.1.104 ipsec 12346 12346
 remote-system-ip 1.1.1.104
 local-color      mpls
 remote-color     public-internet
 mean-loss        0
 mean-latency     53
 mean-jitter      40
 sla-class-index  0
                                                          IPV6 TX  IPV6 RX
       TOTAL          AVERAGE  AVERAGE  TX DATA  RX DATA  DATA     DATA
INDEX  PACKETS  LOSS  LATENCY  JITTER   PKTS     PKTS     PKTS     PKTS
----------------------------------------------------------------------------
0      11       0     13       23       974      0        0        0
1      11       0     100      58       1525     0        0        0
2      11       0     45       38       0        0        0        0

app-route statistics 192.168.2.101 192.168.2.104 ipsec 12346 12346
 remote-system-ip 1.1.1.104
 local-color      mpls
 remote-color     mpls
 mean-loss        0
 mean-latency     0
 mean-jitter      0
 sla-class-index  0
                                                          IPV6 TX  IPV6 RX
       TOTAL          AVERAGE  AVERAGE  TX DATA  RX DATA  DATA     DATA
INDEX  PACKETS  LOSS  LATENCY  JITTER   PKTS     PKTS     PKTS     PKTS
----------------------------------------------------------------------------
0      11       0     0        0        0        520      0        0
1      11       0     0        0        0        780      0        0
2      11       0     0        0        1        1        0        0

cEdge1#
the result shows that, traffic between site1 and site4 are routed through MPLS in site1 and received also in MPLS link in site4. We can also see the result of QoS measurements.
Application Aware Routing Configuration
Now we can start to do cisco SD-WAN application aware routing for this specific traffic.
First we have to specify, what is QoS requirement of our application.
# just check one of existing SLA Class
CONFIGURATION -> POLICIES -> Centralized Policy -> Custom Options -> Lists -> SLA Class
 Name: Voice-And-Video
 Loss(%): 2
 Latency(ms): 45
 Jitter(ms): 30
As you can see, some SLA classes and their QoS requirements are already preconfigured. For example, voice and video must be routed in a path with delay of less than 45 milliseconds and jitter of less than 30 milliseconds and less than 2 percent loss.
We assume that our data traffic is some kind of voice and video and ask routers to route our traffic on a path with these QoS values.
Now we can configure our new policy. We suppose that our ICMP traffic require voice-and-video QoS values.
CONFIGURATION -> POLICIES -> Centralized Policy -> Custom Options -> Traffic Policy -> Application Aware Routing -> Add Policy -> create New
 Sequence 1:
  Match:
   Protocol: 1
  Action:
   SLA Class List: Voice-And-Video
   Preferred Color: public-internet
   strict: false
Strict option means that traffic will only be sent through our preferred path and if QoS requirements can not be met then traffic will be dropped. Sometimes it is better to receive a busy line instead of low quality communication.
Then it has to be applied to existing vSamrt_Policy.
CONFIGURATION -> POLICIES -> Centralized Policy -> vSamrt_Policy -> Edit -> Traffic Rules -> Application Aware Routing -> Add Policy -> Import Existing -> App_Aware_Routing

# then change to Policy Application Tab

Policy Application -> Application-Aware Routing -> New Site List and VN List
 Site List; HUB, SPOKES
 VPN List: VPN10
We can preview final Viptella commands.
viptela-policy:policy
  sla-class Voice-And-Video
   jitter 30
   latency 45
   loss 2
  !
...
 !
 app-route-policy _VPN10_App_Aware_Routing
  vpn-list VPN10
    sequence 1
     match
      protocol 1
      source-ip 0.0.0.0/0
     !
     action
      sla-class Voice-And-Video preferred-color public-internet
     !
    !
 !

apply-policy
...
 site-list HUB
  app-route-policy _VPN10_App_Aware_Routing
 !
 site-list SPOKES
  app-route-policy _VPN10_App_Aware_Routing
 !
Then we save an activate our new policy.
Now we can generate the same ICMP traffic again to check if our application aware routing effects the traffic.
cEdge1#ping vrf 10 172.16.14.1 size 18024 repeat 100
Type escape sequence to abort.
Sending 100, 18024-byte ICMP Echos to 172.16.14.1, timeout is 2 seconds:
!!!!!!!!!!!!!!!!!!!!!!!!!!!!!!!!!!!!!!!!!!!!!!!!!!!!!!!!!!!!!!!!!!!!!!
!!!!!!!!!!!!!!!!!!!!!!!!!!!!!!
Success rate is 100 percent (100/100), round-trip min/avg/max = 4/5/11 ms
cEdge1#cEdge1#show sdwan app-route stats remote-system-ip 1.1.1.104
app-route statistics 192.168.1.101 192.168.1.104 ipsec 12346 12346
remote-system-ip 1.1.1.104
local-color public-internet
remote-color public-internet
mean-loss 0
mean-latency 0
mean-jitter 0
sla-class-index 0,1
IPV6 TX IPV6 RX
TOTAL AVERAGE AVERAGE TX DATA RX DATA DATA DATA
INDEX PACKETS LOSS LATENCY JITTER PKTS PKTS PKTS PKTS
----------------------------------------------------------------------------
0 11 0 0 0 2499 0 0 0
1 10 0 0 0 1 1 0 0
2 11 0 0 0 0 0 0 0
app-route statistics 192.168.1.101 192.168.2.104 ipsec 12346 12346
remote-system-ip 1.1.1.104
local-color public-internet
remote-color mpls
mean-loss 0
mean-latency 0
mean-jitter 0
sla-class-index 0,1
IPV6 TX IPV6 RX
TOTAL AVERAGE AVERAGE TX DATA RX DATA DATA DATA
INDEX PACKETS LOSS LATENCY JITTER PKTS PKTS PKTS PKTS
----------------------------------------------------------------------------
0 11 0 0 0 1 1 0 0
1 12 0 0 0 0 0 0 0
2 11 0 0 0 0 0 0 0
app-route statistics 192.168.2.101 192.168.1.104 ipsec 12346 12346
remote-system-ip 1.1.1.104
local-color mpls
remote-color public-internet
mean-loss 0
mean-latency 0
mean-jitter 0
sla-class-index 0,1
IPV6 TX IPV6 RX
TOTAL AVERAGE AVERAGE TX DATA RX DATA DATA DATA
INDEX PACKETS LOSS LATENCY JITTER PKTS PKTS PKTS PKTS
----------------------------------------------------------------------------
0 11 0 0 0 0 0 0 0
1 11 0 0 0 0 0 0 0
2 11 0 0 0 0 0 0 0
app-route statistics 192.168.2.101 192.168.2.104 ipsec 12346 12346
remote-system-ip 1.1.1.104
local-color mpls
remote-color mpls
mean-loss 0
mean-latency 0
mean-jitter 0
sla-class-index 0,1
IPV6 TX IPV6 RX
TOTAL AVERAGE AVERAGE TX DATA RX DATA DATA DATA
INDEX PACKETS LOSS LATENCY JITTER PKTS PKTS PKTS PKTS
----------------------------------------------------------------------------
0 11 0 0 0 0 1300 0 0
1 11 0 0 0 1 1 0 0
2 12 0 0 0 0 0 0 0
cEdge1#the result shows that, traffic between site1 and site4 are routed now through internet in site1 as we have configured in our application routing.