Monitoring and troubleshooting security policies on Juniper SRX device is critical especially when you have a problem in a connection through SRX device.
In this section we will learn five practical commands, specific for the purpose of security policy monitoring and troubleshooting.
Monitoring and Troubleshooting security policies commands
In this section we will examine five monitoring commands to troubleshoot connections over juniper SRX.
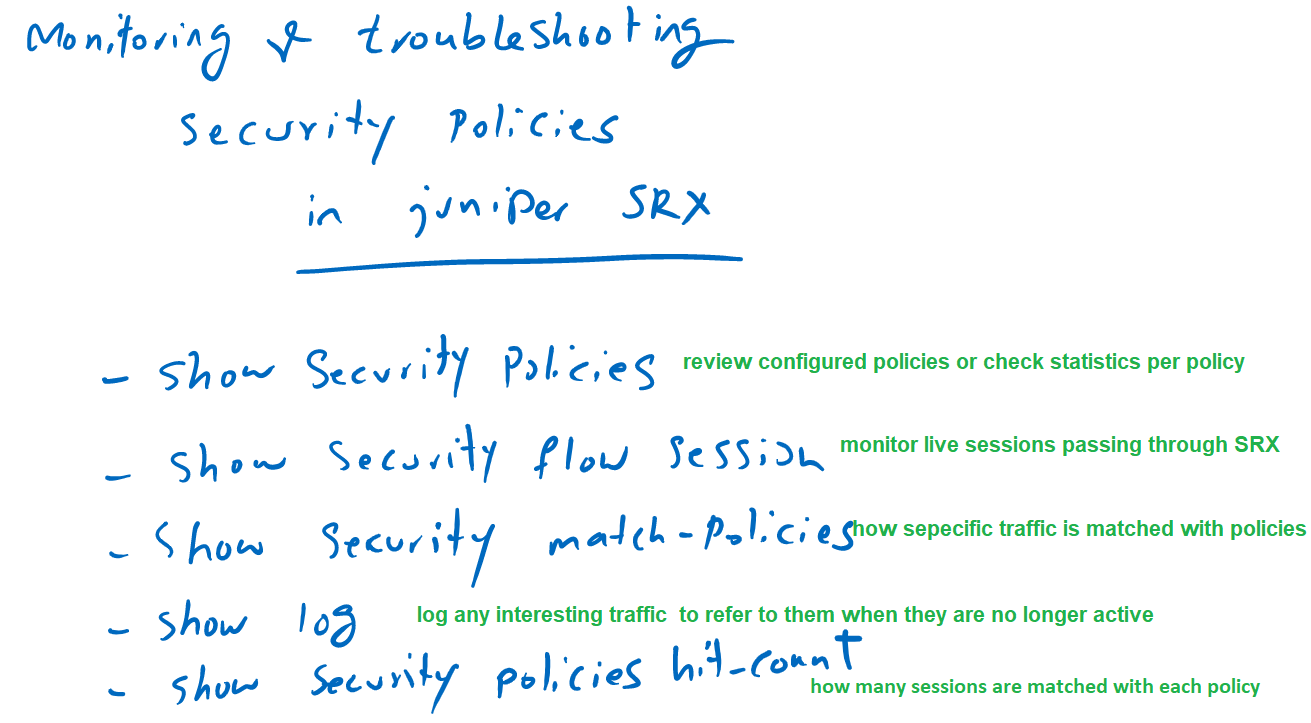
The first command “show security policies”, is just to check and review the configured security policies per interface or per zone-pair.
If you enter “details” as a parameter in this command, it is also possible to monitor the statistics for each policy. in other words, byte rate, packet rate and session rate for incoming and outgoing traffic matching each policy.
In the second command “show security flow session”, you can monitor all active sessions through juniper SRX. This command is very useful and handy commands in connection troubleshooting.
With “grep” command or the parameters of this command, we can easily limit the output for specific sessions.
With the command “show security match-policies”, you can monitor how a specific traffic with a given source and destination IP address, protocol and source and destination ports are matched with security policies. With which policy it is matched and what will be action of the traffic.
You can also log any interesting traffic and refer to it later when it is no longer active. For logging any traffic, the action of “log session-init” or “log session-close” must be configured in the security policy to log traffic at the beginning of new sessions matching the policy or when the sessions are terminated.
With “show security policies hit-count”, you can monitor how many sessions are matched with each policy.
Now let’s check each command in a real environment.
The Command “show security policies”
First the command, “show security policies”, which mostly is used to review the configuration.
Let’s check and review the configured policies only from inside to outside zone
[edit]
rayka# run show security policies from-zone inside to-zone outside
From zone: inside, To zone: outside
  Policy: PERMIT-WEB, State: enabled, Index: 8, Scope Policy: 0, Sequence number: 1, Log Profile ID: 0
    Source vrf group: any
    Destination vrf group: any
    Source addresses: NET_192_168_10_0__24
    Destination addresses: any
    Applications: junos-http
    Source Tenant: any
    Destination Service: any
    Source identity feeds: any
    Destination identity feeds: any
    Action: permit, log, count
  Policy: PERMIT-TELNET, State: enabled, Index: 9, Scope Policy: 0, Sequence number: 2, Log Profile ID: 0
...
As you can see, all configured policies are listed. For each policy it also shows how traffics are matched and what is the action of the policy.
If you enter the keyword “detail” at the end of this command, the statistic for each policy will also be displayed which includes byte rate, packet rate and session rate for incoming and outgoing traffic.
rayka# run show security policies from-zone inside to-zone outside detail
Policy: PERMIT-WEB, action-type: permit, services-offload:not-configured , State: enabled, Index: 8, Scope Policy: 0
...
  Policy statistics:
    Input  bytes       :                    0                    0 bps
      Initial direction:                    0                    0 bps
      Reply direction  :                    0                    0 bps
    Output bytes       :                    0                    0 bps
      Initial direction:                    0                    0 bps
      Reply direction  :                    0                    0 bps
    Input  packets     :                    0                    0 pps
      Initial direction:                    0                    0 pps
      Reply direction  :                    0                    0 pps
    Output packets     :                    0                    0 pps
      Initial direction:                    0                    0 pps
      Reply direction  :                    0                    0 pps
    Session rate       :                    0                    0 sps
    Active sessions    :                    0
    Session deletions  :                    0
    Policy lookups     :                    0
Policy: PERMIT-TELNET, action-type: permit, services-offload:not-configured , State: enabled, Index: 9, Scope Policy: 0
...
The Command “show security flow session”
With the command “show security flow session”, all live sessions through juniper SRX will be displayed which is very practical in connection troubleshooting.
rayka# run show security flow session
Session ID: 30507, Policy name: PERMIT-TELNET/9, State: Stand-alone, Timeout: 1778, Valid
  In: 192.168.10.121/2472 --> 192.168.1.88/23;tcp, Conn Tag: 0x0, If: ge-0/0/1.0, Pkts: 5, Bytes: 257,
  Out: 192.168.1.88/23 --> 192.168.10.121/2472;tcp, Conn Tag: 0x0, If: ge-0/0/0.0, Pkts: 4, Bytes: 236,

Session ID: 30551, Policy name: PERMIT-ICMP/10, State: Stand-alone, Timeout: 2, Valid
  In: 192.168.10.121/1 --> 192.168.1.88/14;icmp, Conn Tag: 0x0, If: ge-0/0/1.0, Pkts: 1, Bytes: 60,
  Out: 192.168.1.88/14 --> 192.168.10.121/1;icmp, Conn Tag: 0x0, If: ge-0/0/0.0, Pkts: 1, Bytes: 60,
...
All sessions information including source and destination IP, protocol and source and destination port is displayed in the output. It also shows with which policy the traffic is matched in juniper SRX.
You can match specific sessions with “grep” command or with the parameters included in the command itself.
The Command “show security match-policies”
With command “show security match-policies”, you can check how a specific traffic sample with be matched with security policies.
rayka# run show security match-policies from-zone inside to-zone outside source-ip 192.168.10.121 destination-ip 192.168.1.88 source-port 1100 destination-port 23 protocol tcp
Policy: PERMIT-TELNET, action-type: permit, services-offload:not-configured , State: enabled, Index: 9
...
  Source addresses:
    NET_192_168_10_0__24(INSIDE): 192.168.10.0/24
  Destination addresses:
    any-ipv4(global): 0.0.0.0/0
    any-ipv6(global): ::/0
...
  Policy statistics:
  For PFE = 0x10 (16)
    Input  bytes       :                  592                    0 bps
      Initial direction:                  276                    0 bps
      Reply direction  :                  316                    0 bps
    Output bytes       :                  592                    0 bps
      Initial direction:                  276                    0 bps
      Reply direction  :                  316                    0 bps
    Input  packets     :                   13                    0 pps
      Initial direction:                    6                    0 pps
      Reply direction  :                    7                    0 pps
    Output packets     :                   13                    0 pps
      Initial direction:                    6                    0 pps
      Reply direction  :                    7                    0 pps
    Session rate       :                    3                    0 sps
    Active sessions    :                    0
    Session deletions  :                    3
    Policy lookups     :                    3
...
Actually it is not a real traffic, and you only ask how a specific sample traffic with a given source and destination IP address, protocol and source and destination port is matched with security policies.
In other words, with which policy a sample traffic will be matched.
It also shows the statistics of the matching policy.
Log Interesting Traffic
The other useful monitoring and troubleshooting command in juniper SRX device is to log any interesting traffic forwarding through juniper SRX device.
With logging, you can monitor and troubleshoot traffic when they are no longer active.
To enable logging, first we have to make sure that we enable the log action in any interesting policy.
To log traffic matching any policy, we have two options, “log session-init” to log any new session matching the policy or “log session-close” to log any sessions, matched the policy, when they are terminated.
rayka# show security policies from-zone inside to-zone outside
policy PERMIT-WEB {
    match {
        source-address NET_192_168_10_0__24;
        destination-address any;
        application junos-http;
    }
    then {
        permit;
        log {
            session-init;
            session-close;
        }
        count;
    }
}
...
We also have to enable SRX syslog service, to configure where the logs are stored and how we can refer to the them at a later time.
To log traffic matching security policies, we write generate a new log file , with the name of, for example FIREWALL, to store any log with any severity and category matching “RT_FLOW_SESSION” keywords.
the command, “set security log mode event“, log the traffic in control plane.
without this command all logs are processed in data plane.
I am not sure, why there is no log output stored in the file without this command.
set system syslog file FIREWALL any any
set system syslog file FIREWALL match RT_FLOW_SESSION
set security log mode event
All traffic matching security policies, will be logged with this specific keyword.
At any time, you can read the content of the log file, with “show log FIREWALL” command.
As an example let’s monitor the content of the log file, but only lines matching a specific IP address, “192.168.1.88”.
[edit]
rayka# run show log FIREWALL | grep 192.168.1.88
Aug  1 15:01:48   RT_FLOW: RT_FLOW_SESSION_CREATE: session created 192.168.10.121/1099->192.168.1.88/23 0x0 junos-telnet 192.168.10.121/1099->192.168.1.88/23 0x0 N/A N/A N/A N/A 6 PERMIT-TELNET inside outside 3318 N/A(N/A) ge-0/0/1.0 UNKNOWN UNKNOWN UNKNOWN N/A N/A -1 N/A N/A N/A Off root N/A N/A
Aug  1 15:01:56   RT_FLOW: RT_FLOW_SESSION_CLOSE: session closed TCP FIN: 192.168.10.121/1099->192.168.1.88/23 0x0 junos-telnet 192.168.10.121/1099->192.168.1.88/23 0x0 N/A N/A N/A N/A 6 PERMIT-TELNET inside outside 3318 12(1204) 11(797) 8 UNKNOWN UNKNOWN N/A(N/A) ge-0/0/1.0 UNKNOWN N/A N/A -1 N/A NA 0 0.0.0.0/0->0.0.0.0/0 NA NA N/A N/A Off root 0 N/A N/A
Aug  1 15:04:33   RT_FLOW: RT_FLOW_SESSION_CREATE: session created 192.168.10.121/1->192.168.1.88/1 0x0 icmp 192.168.10.121/1->192.168.1.88/1 0x0 N/A N/A N/A N/A 1 PERMIT-ICMP inside outside 3577 N/A(N/A) ge-0/0/1.0 UNKNOWN UNKNOWN UNKNOWN N/A N/A -1 N/A N/A N/A Off root N/A N/A
Aug  1 15:04:34   RT_FLOW: RT_FLOW_SESSION_CREATE: session created 192.168.10.121/1->192.168.1.88/2 0x0 icmp 192.168.10.121/1->192.168.1.88/2 0x0 N/A N/A N/A N/A 1 PERMIT-ICMP inside outside 3584 N/A(N/A) ge-0/0/1.0 UNKNOWN UNKNOWN UNKNOWN N/A N/A -1 N/A N/A N/A Off root N/A N/A
...
For example to see how traffics are denied in SRX device ,with match the output with the name of last policy, “DENY-ALL” policy.
if you remeber, in the previous section, we have configured a explicit “DENY-ALL” rule as the last rule just with the target to log any denied traffic.
rayka# run show log FIREWALL | grep DENY-ALL
Aug  1 15:01:40   RT_FLOW: RT_FLOW_SESSION_DENY: session denied 192.168.10.121/1098->192.168.1.50/3306 0x0 None 6(0) DENY-ALL inside outside UNKNOWN UNKNOWN N/A(N/A) ge-0/0/1.0 No Rejected by policy 3309 N/A N/A -1 N/A N/A N/A N/A N/A
Aug  1 15:01:40   RT_FLOW: RT_FLOW_SESSION_DENY: session denied 192.168.10.121/1098->192.168.1.50/3306 0x0 None 6(0) DENY-ALL inside outside UNKNOWN UNKNOWN N/A(N/A) ge-0/0/1.0 No Rejected by policy 3311 N/A N/A -1 N/A N/A N/A N/A N/A
Aug  1 15:01:48   RT_FLOW: RT_FLOW_SESSION_DENY: session denied 192.168.10.121/1100->192.168.1.50/3306 0x0 None 6(0) DENY-ALL inside outside UNKNOWN UNKNOWN N/A(N/A) ge-0/0/1.0 No Rejected by policy 3321 N/A N/A -1 N/A N/A N/A N/A N/A
Aug  1 15:01:48   RT_FLOW: RT_FLOW_SESSION_DENY: session denied 192.168.10.121/61743->192.168.1.240/53 0x0 junos-dns-udp 17(0) DENY-ALL inside outside UNKNOWN UNKNOWN N/A(N/A) ge-0/0/1.0 No Rejected by policy 3322 N/A N/A -1 N/A N/A N/A N/A N/A
...
Or we can match any sessions matching a specific application, for example ftp, with “grep ftp” command.
rayka# run show log FIREWALL | grep ftp
Aug  1 19:45:36   RT_FLOW: RT_FLOW_SESSION_DENY: session denied 192.168.10.121/2052->192.168.1.88/21 0x0 junos-ftp 6(0) DENY-ALL inside outside UNKNOWN UNKNOWN N/A(N/A) ge-0/0/1.0 No Rejected by policy 22571 N/A N/A -1 N/A N/A N/A N/A N/A
Aug  1 19:45:36   RT_FLOW: RT_FLOW_SESSION_DENY: session denied 192.168.10.121/2052->192.168.1.88/21 0x0 junos-ftp 6(0) DENY-ALL inside outside UNKNOWN UNKNOWN N/A(N/A) ge-0/0/1.0 No Rejected by policy 22572 N/A N/A -1 N/A N/A N/A N/A N/A
Aug  1 19:45:37   RT_FLOW: RT_FLOW_SESSION_DENY: session denied 192.168.10.121/2052->192.168.1.88/21 0x0 junos-ftp 6(0) DENY-ALL inside outside UNKNOWN UNKNOWN N/A(N/A) ge-0/0/1.0 No Rejected by policy 22576 N/A N/A -1 N/A N/A N/A N/A N/A
The command “show security policies hit-count”
With the command “show security policies hit-count”, you can monitor, how many sessions are matched with each policy.
rayka# run show security policies hit-count
Logical system: root-logical-system
Index   From zone        To zone           Name           Policy count  Action
1       trust            trust             default-permit 0             Permit
2       trust            untrust           default-permit 0             Permit
3       outside          junos-host        permit-all     0             Permit
4       inside           junos-host        PERMIT_ALL     4             Permit
5       inside           outside           DENY-ALL       540           Reject
6       inside           outside           PERMIT-WEB     0             Permit
7       inside           outside           PERMIT-TELNET  3             Permit
8       inside           outside           PERMIT-ICMP    7             Permit

Number of policy: 8
If the hit counting is increasing, it means that sessions are still matching the policy and it can be a good sign.